
All markets/Indiana/Indianapolis-Carmel-Greenwood, IN1.5M adults 21+
Indianapolis sits near the middle for most spirits; mezcal and imported liqueurs rank highest.
Based on Iowa; its group checked in Pennsylvania. Compared with the 387 US metro areas.
How to read this
Each score: how closely Indianapolis’ people match the Iowa counties where that drink’s sales make up a bigger share of spirits sales. Not a sales figure.
Each row ranks Indianapolis among 387 metros for one category. It does not compare categories with each other.
Beside each category is the Census measure the model leans on most for it here.
Each category’s standing comes from a model fitted to Iowa county sales on public Census measures only, checked in Pennsylvania for its group; only the 8 spirits groups and the 24 subcategories that passed are ranked.
An association between places, not a cause or a sales forecast.
The whole book: 32 ranked categories
Show all 32Show the top 8 and bottom 3
Each dot is where Indianapolis ranks among the 387 metros for that category, on the scale printed above its block. Point at a row to see it on the map; click to read it.Tap a row to read it.
Who lives here
The usual metro = the middle of the 387 US metro areas.
Tap a bar: the book follows.
Leans in
Leans away from
- Flavored RumMore professional jobs than the usual metro: 44.3% against 39.0%.347thof 387 metros
- Canadian WhiskyMore women earning $75k+ than the usual metro: 20.8% against 15.5%.331stof 387 metros
- Tennessee WhiskeyMore bachelor's degrees than the usual metro: 38.5% against 31.0%.300thof 387 metros
Tied with: Liqueurs and Cordials
Indianapolis on the map
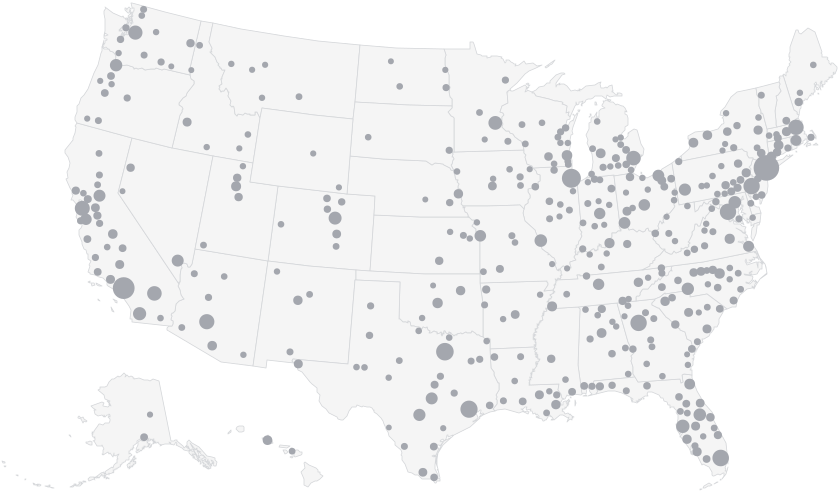
Indianapolis among the 387 US metro areas.
Did you know?
20thlowest of 387 metrosIndianapolis is among the 20 metros where service jobs are least common: 13.9% here, usual 17.0%.
Ask BevGenie. See which Indianapolis accounts match your book.
Free for 15 days. No credit card.
What this rests on
County sales by category in Iowa (99 counties, Oct 2025 to Sep 2026), checked in Pennsylvania (67 counties, Jul 2024 to Jun 2025), plus Census ACS 2024 5-year. An association between places, not a cause or a sales forecast.